Scholaranium —
practice that turns every attempt into actionable insight

Scholaranium is e-GMAT's practice platform — it turns every quiz attempt into actionable insight, surfacing where a student is strong, where they're weak, whether they're improving, and the exact gaps to fix. As the sole product designer, I took the product and screen requirements, defined and visualized every flow, and delivered the working prototype the engineering team built into the live product.

The opportunity

Why the rebuild had to happen

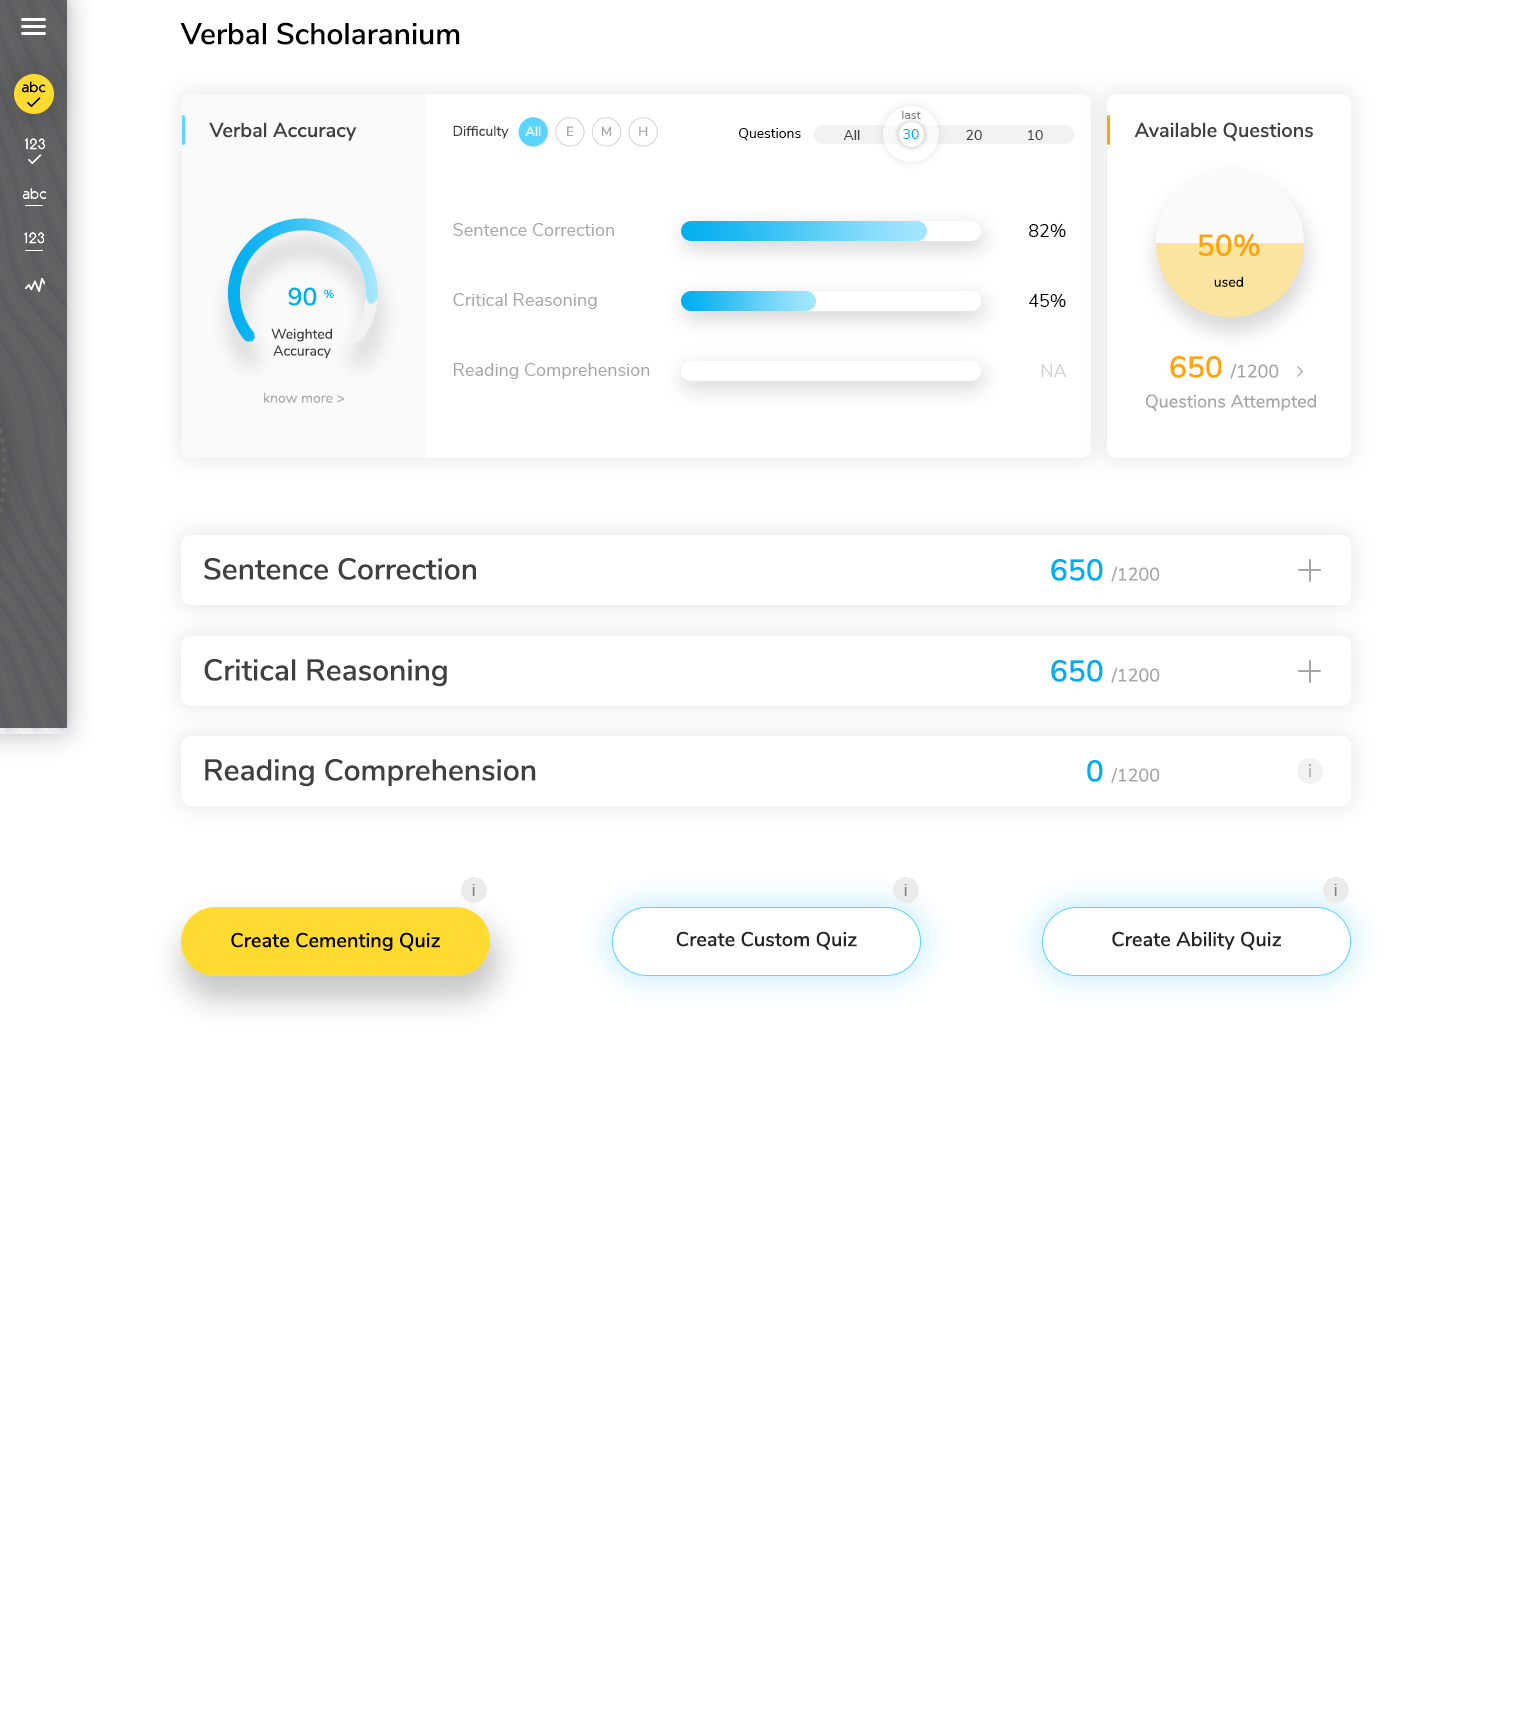
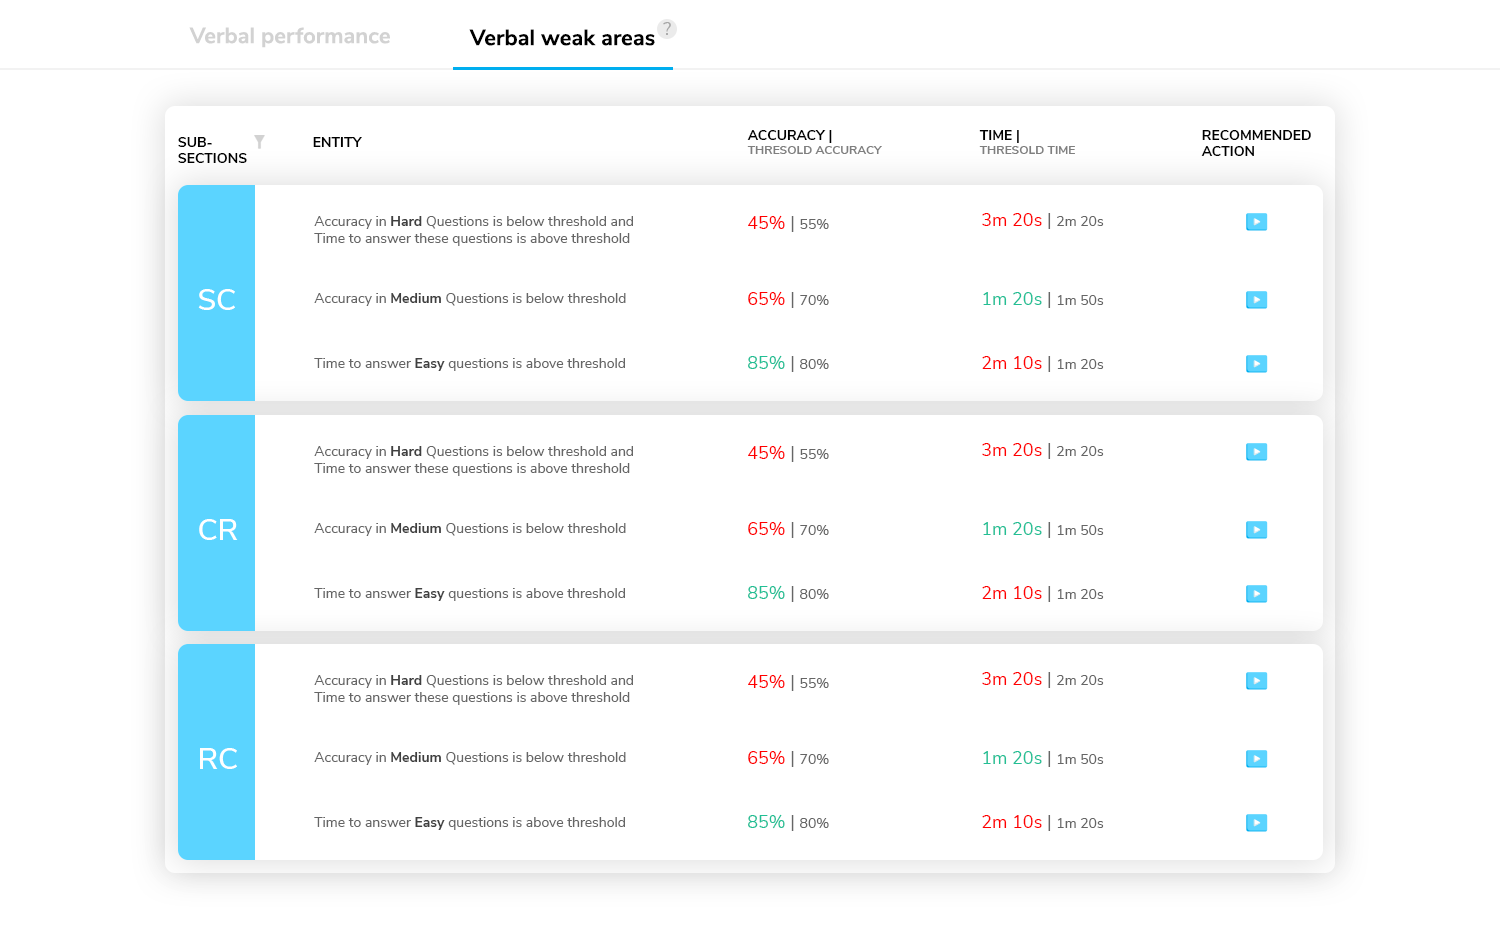
A practice platform earns its keep on the half of the job beyond serving questions — helping students see their strengths and weaknesses and actually improve. On that half, the old platform was thin: bare-minimum analytics that surfaced none of the things that move a score. The questions were strong; the intelligence around them was missing.

Problem statement

What students were doing wrong

Without that intelligence, students practiced blind. The platform never clearly surfaced:

  1. Which areas were weak, and which were already strong
  2. Whether their scores were trending up or flat
  3. How many quality questions they had left
  4. Whether a good score was earned — or just lucky

So they reviewed only the questions they got wrong, mislabeled ability gaps as "timing problems," and kept practicing without improving. Only the few who already reviewed like a private tutor got the real value.

Get more out of every quiz

A score you can't trust is noise. Every attempt had to show whether a result was real — earned, rushed, or lucky — and hand back a precise list of what to review and why, the way a private tutor would.

Make weakness precise

Vague data is as useless as no data. The analytics had to take a student from "I'm weak in Verbal" to "I'm weak in hard LCM and GCD questions, this month" — weakness pinned to subsection, difficulty, and recency.

Teach each metric where it lives

None of these metrics existed in the market; students didn't know they needed them. So every new metric had to explain itself in place — the causal logic shown right on the chart, with tooltips, launchers, and worked examples — so it landed without a manual.

Most practice tools hand back a score and a pile of data. Scholaranium hands back a verdict you can trust, a weakness pinned to the exact block, and the reason behind both — practice that diagnoses, not just drills.

Scholaranium is two products in one loop — a place to practice, and an analytics engine that reads what you did. The decisions below follow the student through it: from the dashboard, into an attempt and the verdict it earns, and out into the analytics that say exactly what to fix next.

3.1Gave the platform one home and two clear intents

Everything starts at the dashboard. A student arrives with one of two intents — take an attempt, or understand how the last ones went — so the dashboard makes both first-class: question counts and quiz types on one side, the way into the analytics on the other. No hunting for where to go next.

Scholaranium — Dashboard
Scholaranium dashboard showing question counts and quiz types alongside the entry into analytics.

One home, two intents — start a quiz, or go understand how the last ones went.

3.2Let students build a quiz worth taking

Practice only helps if it targets the right thing. The custom-quiz builder lets a student assemble exactly the set they need — by subsection, difficulty, and source, even pulling from their bookmarks and past mistakes — through a short, guided two-step flow instead of a wall of filters.

Scholaranium — Custom quiz
Scholaranium custom-quiz builder step one: choosing subsection, difficulty, and source.

Choose exactly what to practice — subsection, difficulty, source, bookmarks, past mistakes.

3.3Put "can you trust this score?" on the results screen

When the attempt ends, the results screen answers one question first: is this score real? Three factors — timing influence, luck, and rush-through — are computed from how long the student took on each question versus the benchmark, and shown right on the timing chart so the cause is visible, not asserted. Get a hard question right in 40 seconds when most people need two minutes? That is flagged as luck, with the evidence beside it.

Scholaranium — Results: can you trust this score?
Results screen surfacing timing influence, luck, and rush-through factors on the timing chart.

Timing influence, luck, and rush-through — read straight off the timing chart, with the evidence in view.

3.4Made the review list explain itself

The auto-curated review list includes questions the student got correct — and that is the point. A question makes the list on two facts, not one: right or wrong, and in time or not. Spent too little (a guess) or too much (which forces rushing later), and it is on the list, grouped under a plain reason: "you got this right — make sure it was for the right reasons." The reason is what built trust in the list.

Scholaranium — The review list
Auto-curated review list with each question grouped under its reason for review.

Each question carries its reason — including the ones the student got right.

3.5Turned a 3-dimensional problem into one chart you read at a glance

Performance lives across three axes — subsection, difficulty, and recency — which overwhelms if you draw it as a plane. So I moved two of them into controls: the student picks a recency window and a difficulty band, and the chart shows one clean breakdown by subsection. Dense data, single read.

Scholaranium — Skill data: overall performance
Skill-data overall-performance chart broken down by subsection, with recency and difficulty as controls.

Two axes become controls; the chart stays a single, readable breakdown by subsection.

3.6Took weakness down to the block

Topic-level data is too sparse to trust — a handful of questions per topic yields no real signal. So analysis groups questions into blocks large enough to be statistically honest, and flags the block, not the topic, where a student should spend energy. "Weak in word problems" becomes "weak in savings-and-interest, hard."

Scholaranium — Block and topic analysis
Block-level analysis flagging the specific blocks where the student is weak.

Blocks are sized to be statistically honest — the flag lands where effort actually pays.

3.7Gave weakness a single destination

A dedicated weak-areas view collects every flagged block in one place, each with a recommended next action — so the student never has to assemble the picture themselves.

Scholaranium — Weak areas
Weak-areas view listing every flagged block with a recommended action.

Every flagged block in one place, each with a recommended next action.

3.8Taught every new metric in place

Luck factor, block-level recency, weighted score — none of it existed elsewhere, so students did not know what they were looking at. Each metric explains itself where it appears, through inline tooltips and contextual launchers, so the student understands it without leaving the screen.

Scholaranium — Metrics that teach themselves
A weak-areas metric with an inline tooltip explaining what it means and how to act on it.

Tooltips and launchers explain each new metric the moment it appears.

BeforeAfter
Practice you could not learn from
Every attempt scored for what to fix
Review only the wrong answers
Review the right answers for the right reasons
"I have a timing problem"
A timing problem in this exact construct
Topic data too thin to trust
Block-level data you can act on
One static accuracy number
Subsection × difficulty × recency
Analytics you needed a tutor to read
Metrics that teach themselves

These are from user-research interviews with students who used the rebuilt platform. They keep pointing at the same things it was designed for — data they can act on, weakness they can see, and scores they can trust.

Quotes are transcribed from recorded student feedback interviews and lightly cleaned for readability; emphasis is mine. The recordings were made by e-GMAT and are used here as supporting content — all credits go to e-GMAT.

What I loved was access to data — you can drill down to where you're lacking and what to improve. Especially the feature where you see the last 15 questions versus the previous 15, and the timing improvement on that.
Saloni
Student interview
The first thing that hit me was how user-friendly it is. It pinpoints which questions you should review the most, and then it tells you why — due to time, or incorrect answers.
Michael
Student interview
It's not only the questions you got wrong, but also the ones you got right where you took more time. That targeted approach is very valuable — it saves a lot of time for a student.
Siddharth
Student interview
The expert tab gives me analysis of questions I never thought I needed. The review list, the raw data, the weighted score — it's definitely an upgrade.
Punith
Student interview
The data is presented in a way I can understand better — the percentages are right there, I don't need to go anywhere else. The last-15 plots show how my prep is going long-term.
Aditya
Student interview
The best part is the metrics — I can see my weak areas and which areas to work on, which wasn't there before.
Tirush
Student interview